For graduate students across the UK—from the London School of Economics to the University of Edinburgh—the transition from consuming research to producing it represents a significant leap in academic rigour. In the social sciences, this challenge often centres on the interpretation of complex statistical data. It is no longer enough to simply report a p-value; modern UK academic standards, particularly at Level 7 (Master’s) and Level 8 (PhD), demand a nuanced understanding of how data translates into human behaviour, policy implications, and social theory.
Interpreting “messy” real-world data requires a blend of mathematical precision and sociological insight. This guide explores the essential frameworks for navigating complex datasets, ensuring your analysis meets the high expectations of UK Higher Education.
1. Beyond the P-Value: The Shift Toward Practical Significance
Historically, the p < 0.05 threshold was the “gold standard” for determining whether a research finding was worth reporting.1 However, contemporary social science research in the UK has moved toward a more holistic view. A small p-value indicates that an effect is likely not due to chance, but it says nothing about the magnitude of that effect.2
Understanding Effect Size
In large-scale social surveys (such as the UK Household Longitudinal Study), even a trivial difference can become “statistically significant” simply due to the sheer volume of participants. To provide a truly academic interpretation, you must report and interpret Effect Size (e.g., Cohen’s d or Pearson’s r).
Expert Insight: According to the University of Manchester’s Social Statistics framework, effect size is independent of sample size and provides a measure of “practical significance.” For instance, a policy intervention might show a statistically significant improvement in student test scores, but if the effect size is only 0.1, the real-world impact may not justify the cost of the programme.
2. Navigating Nested and Longitudinal Data Structures
Social science rarely happens in a vacuum. Individuals are “nested” within households, which are nested within neighbourhoods, which are nested within cities. This hierarchical structure is a hallmark of complex data.
Multilevel Modelling (MLM)
When interpreting data from UK schools, for example, a standard regression might overlook the fact that students in the same classroom share a common environment. Using Multilevel Modelling allows you to account for these “cluster effects.” When writing your dissertation, it is vital to explain why you chose a hierarchical model over a flat one—this demonstrates a high level of methodological awareness.
The Value of Longitudinal Analysis
The UK is home to world-class longitudinal datasets like the 1958 National Child Development Study. Interpreting this data requires understanding “change over time” rather than just a snapshot.Key techniques include:
- Growth Curve Modelling: Tracking the trajectory of a variable (like income or well-being) over years.4
- Causal Inference: Moving beyond “correlation” to understand if an earlier event (e.g., childhood poverty) directly caused a later outcome (e.g., adult health).
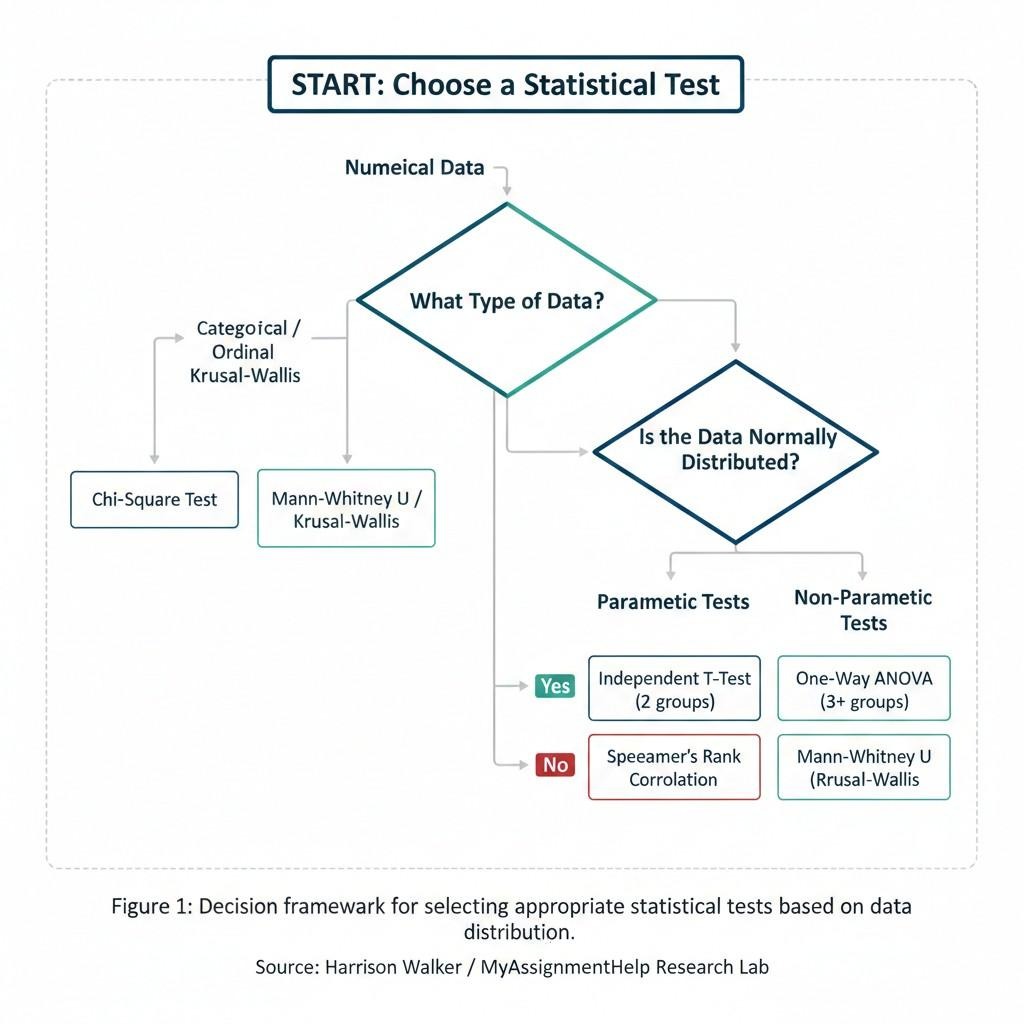
3. Choosing the Right Statistical Test
One of the most common “red flags” in graduate work is the application of a parametric test to non-parametric data. To rank among the top of your cohort, your methodology must be airtight.
| Type of Data | Goal | Recommended Test |
| Numerical (Normal Distribution) | Compare 2 groups | Independent T-Test |
| Numerical (Normal Distribution) | Compare 3+ groups | One-Way ANOVA |
| Categorical/Nominal | Test Association | Chi-Square Test |
| Ordinal (Likert Scales) | Correlation | Spearman’s Rank |
| Complex Relationships | Predict Outcomes | Multiple Regression |
While basic software can run these tests, interpreting the outputs correctly remains a hurdle. For students handling highly specialised datasets, referencing UK statistics assignment help resources can provide the clarity needed to ensure that tests like the Mann-Whitney U or Kruskal-Wallis are applied when normality assumptions are violated.
4. Qualitative-Quantitative Integration (Mixed Methods)
In the UK, there is a strong tradition of Mixed Methods Research (MMR). Complex data interpretation often involves using quantitative trends to identify “what” is happening, while qualitative interviews explain “why.”
When interpreting statistical outliers—those data points that don’t fit the trend—don’t simply delete them as “errors.” In social science, an outlier might represent a marginalised group or a unique social phenomenon. A high-distinction student will discuss these anomalies with reference to existing social theory, perhaps suggesting that current management frameworks fail to account for specific cultural variables.
5. Ethical Integrity and Data Transparency
The UK Data Service and the British Sociological Association (BSA) maintain strict ethical guidelines regarding data interpretation. “Data cleaning” is a necessary step, but it must be transparent.
- Avoid “P-Hacking”: Do not run multiple tests until you find a significant result.
- Acknowledge Bias: Every dataset has limitations, from sampling bias to non-response error. Addressing these “head-on” in your discussion section increases your credibility.
- GDPR Compliance: Even in the analysis phase, ensure that any secondary data used is anonymised and handled according to UK law.
6. Best Practices for Reporting Results
To ensure your content meets the professional standards of UK journals and markers:
- Use Plain English: The Government Analysis Function advises that while the math is complex, the explanation should be accessible. Avoid jargon where a simple word will suffice.
- Round Appropriately: Reporting a mean age as “24.5678” suggests a level of precision that social science data rarely possesses. “24.6” is usually sufficient.
- Visualise with Purpose: Use charts (Histograms, Scatterplots, Boxplots) not just to look good, but to reveal patterns that numbers alone might hide.
- Reference the Software: Always state whether you used R, SPSS, Stata, or Python. This allows for reproducibility, a cornerstone of scientific integrity.
Conclusion: The Path to Distinction
Interpreting complex statistical data is as much an art as it is a science. It requires the ability to look at a spreadsheet of 10,000 rows and see the human story beneath the numbers. By moving beyond p-values, embracing multilevel structures, and maintaining ethical transparency, UK graduate students can produce research that is not only statistically sound but socially impactful.
The journey from a “raw dataset” to a “polished dissertation” is rigorous. For those navigating the complexities of advanced modules, leveraging expert academic guides and peer-reviewed resources is a strategic way to ensure your work meets the exacting standards of the UK’s top-tier universities.
References & Resources:
- UK Data Service (2024). Ethical obligations in social research.
- University of Manchester (2025). Data Analytics and Social Statistics Framework.
- LSE Department of Statistics.Research in Social Statistics & Causal Inference.
- EQUATOR Network. The SAMPL Guidelines for Statistical Reporting.
About The AuthorHarrison Walker is an education expert and professional academic writer at MyAssignmentHelp. He has authored numerous guides on Statistics and Strategic Management, providing students in the UK with the tools needed to excel in Level 7 and Level 8 degree programmes.